
Commercial electric bills can be complex documents, filled with industry-specific terminology and multiple charge categories. Yet understanding these details is essential for controlling operational expenses, identifying saving opportunities, and making informed decisions about renewable energy investments like solar power.
The Critical Components of Commercial Utility Bills
Commercial electric bills contain several distinct sections, each providing crucial information about your energy consumption and costs. Understanding these components allows you to identify patterns, spot anomalies, and develop targeted cost-reduction strategies. Let’s examine the key elements that make up your bill and what they reveal about your facility’s energy profile.
Account Information and Usage Summary
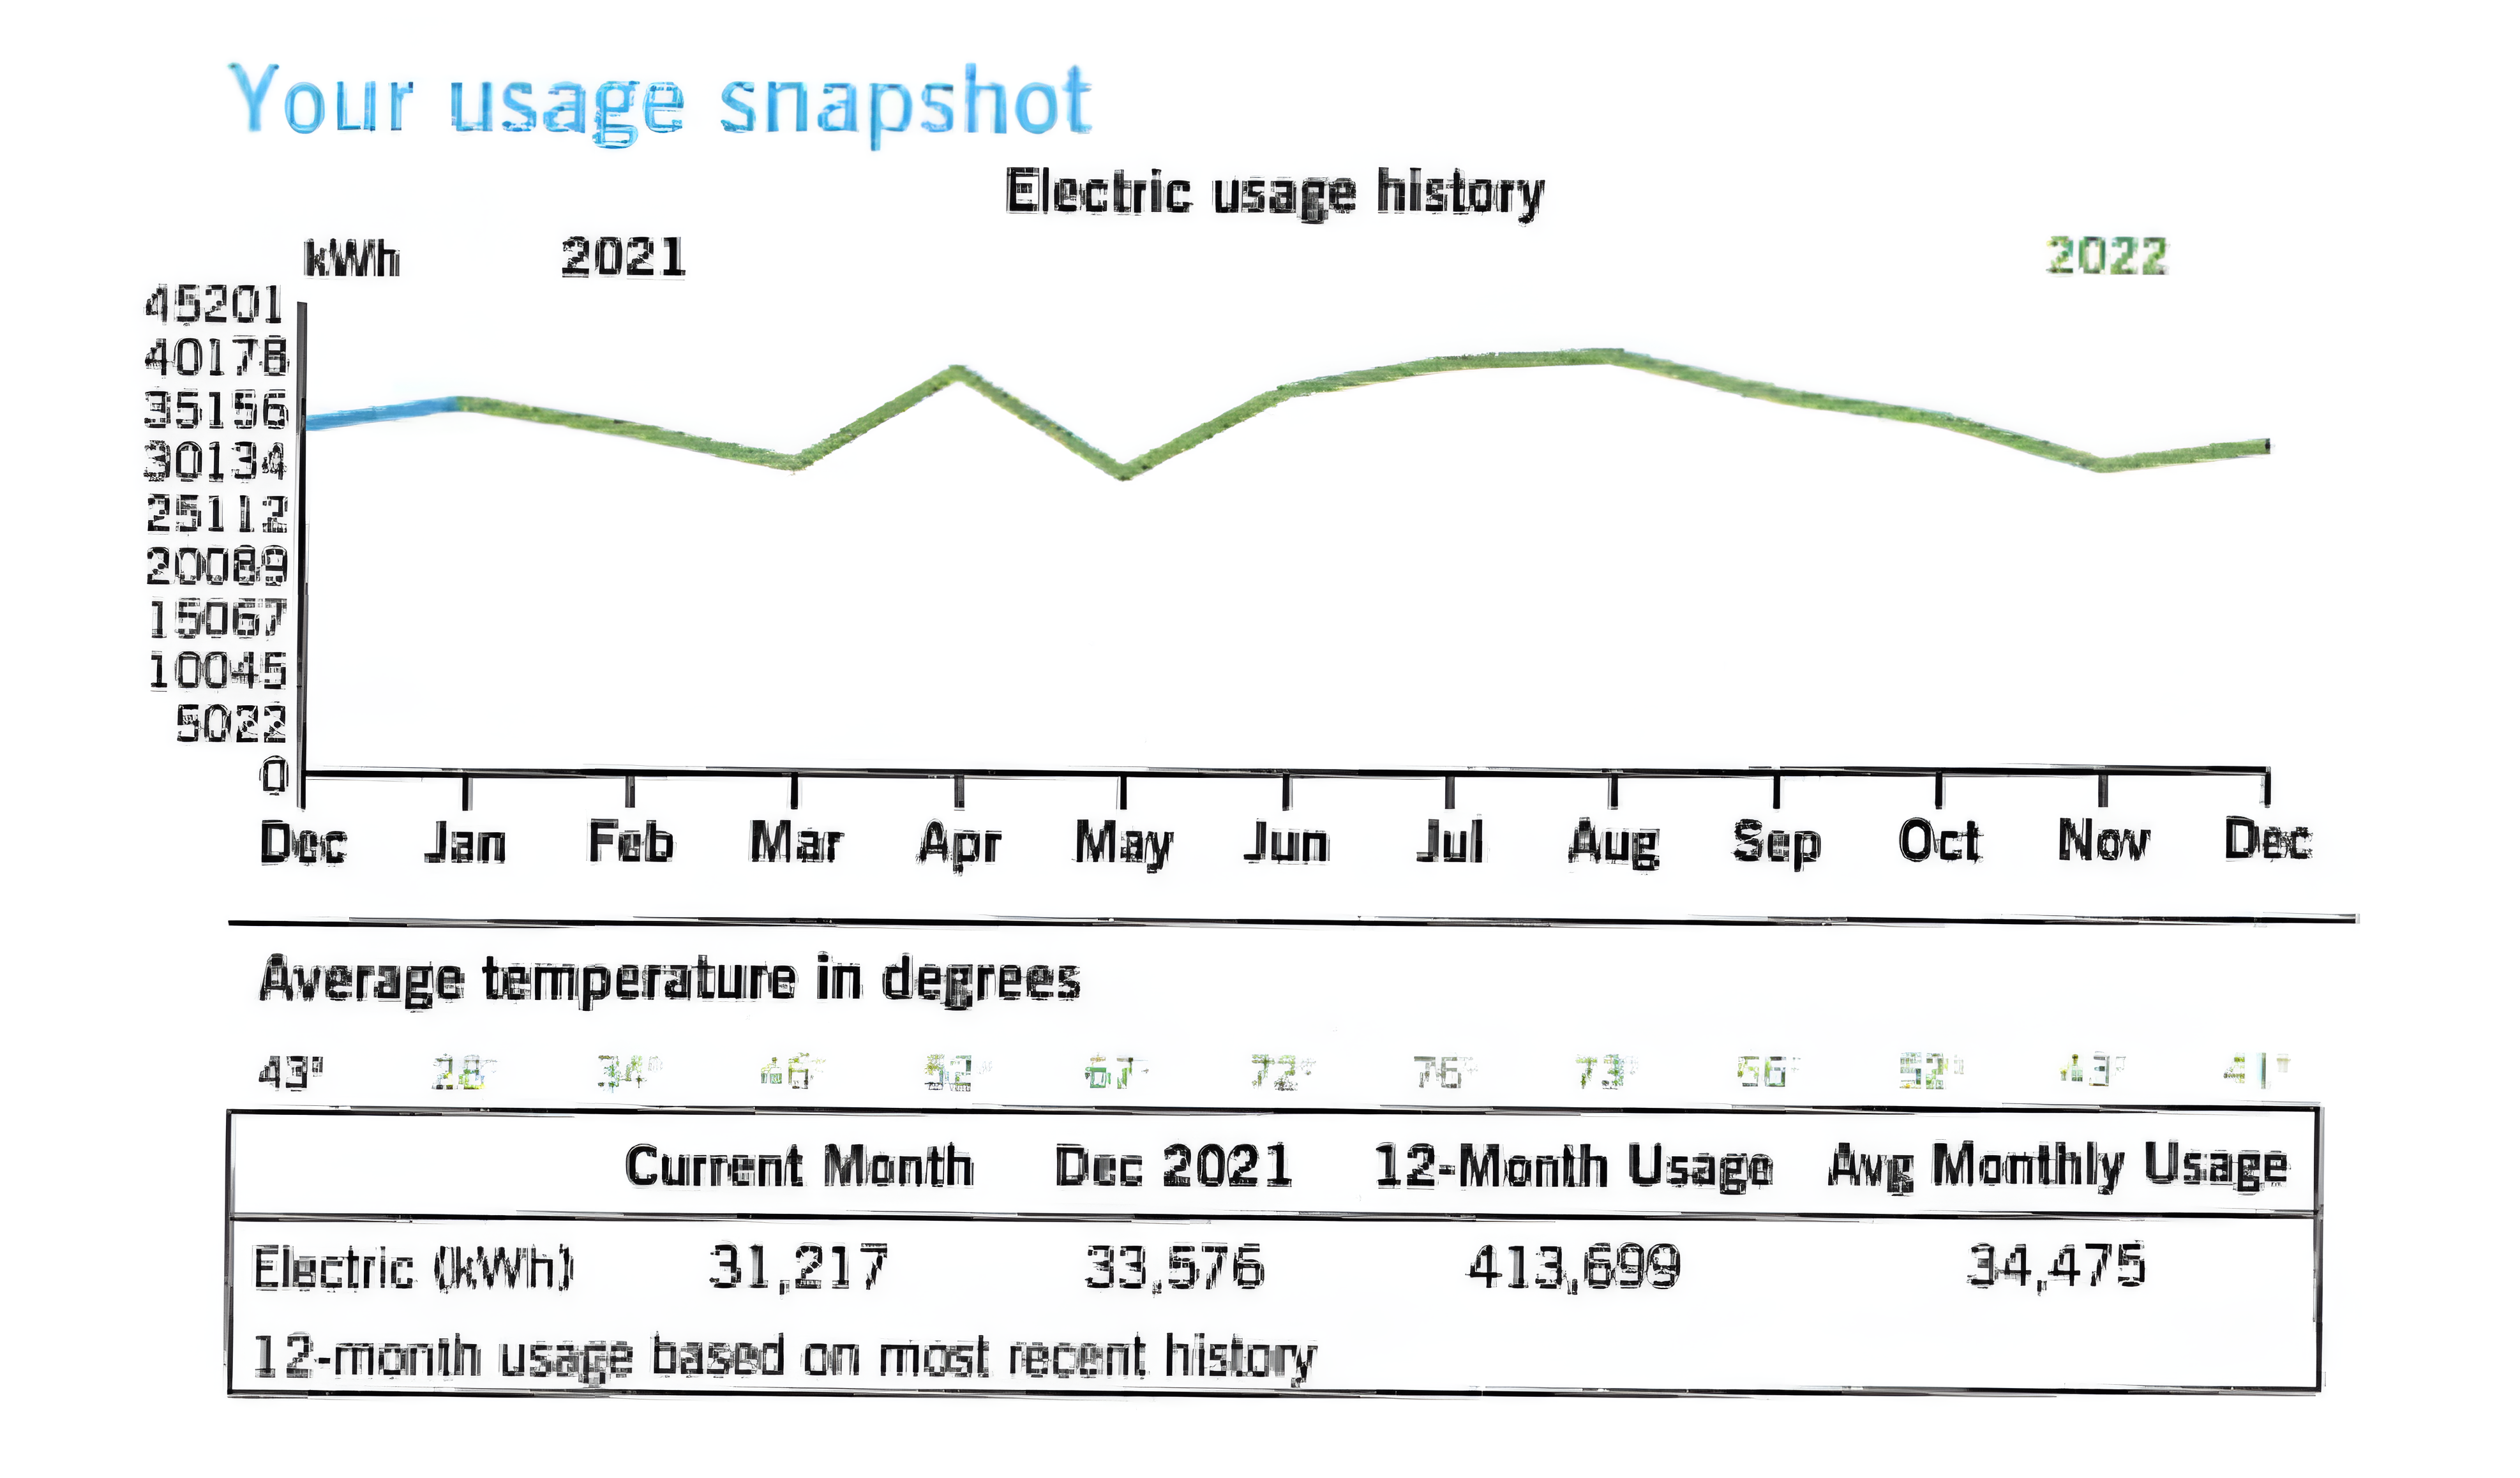
Every commercial bill begins with basic account information and a usage snapshot comparing your current consumption to historical patterns. This data helps identify seasonal trends and potential anomalies in your energy profile.
For example, many electric bills include a 12-month usage history graph showing kWh consumption patterns alongside average monthly temperatures—allowing you to correlate energy usage with seasonal demands.
The Dual Cost Structure: Usage vs. Demand Charges
Usage Charges (kWh): Based on the total volume of electricity consumed during the billing period, measured in kilowatt-hours (kWh). These charges appear as a rate multiplied by your consumption.
- Example: “ENERGY CHARGE: 188187.60 kWh @ 0.069830000” = $13,141.14
Demand Charges (kW): Based on your peak electricity usage—the maximum power drawn at any point during the billing period, typically measured in 15-minute intervals. These charges often represent 30-70% of commercial electricity costs.
- Example: “Distribution-Demand Charge 612.530 kW @ $6.96780000” = $4,267.98
- Example: Included in the “Distribution Related Component” charge of $1,612.85
Understanding the difference between these two charge types is crucial: while usage charges accumulate gradually through consumption, a single 15-minute spike can establish your demand charge for the entire month.
Rate Structure Complexities
Commercial electric rates include various structures that impact your costs.
Time-of-Use (TOU) Rates: Different prices based on when electricity is used.
- On-Peak hours (typically business hours): Higher rates
- Off-Peak hours (evenings/weekends): Lower rates
Most bills separately tracks on-peak usage (e.g., 69,463.200 kWh) and off-peak usage (e.g., 118,724.400 kWh).
Demand Ratchets: Some rate structures base your minimum billed demand on a percentage of your highest demand in previous months—meaning a single high-demand month can affect your bills for up to a year.
Power Factor Adjustments: Measures how efficiently your equipment uses electricity. Poor power factor can result in penalties or higher rates.
Additional Line Items
- Customer Charge: A fixed monthly fee regardless of consumption.
- Distribution Charges: Costs for delivering electricity through local infrastructure.
- Riders and Adjustments: Additional regulatory-approved charges for specific costs.
Deregulated Markets: Supply vs. Delivery
In states with deregulated electricity markets, bills are divided between:
- Delivery charges from your local utility (e.g., Duke Energy, Ohio Edison) covering the infrastructure costs of getting electricity to your facility. These charges include customer service fees, distribution demand charges, and various riders.
- Supply/Generation charges from your chosen supplier (e.g., Champion Energy Services in the sample bills) covering the actual electricity production costs. These typically appear as a fixed rate multiplied by your total kWh usage.
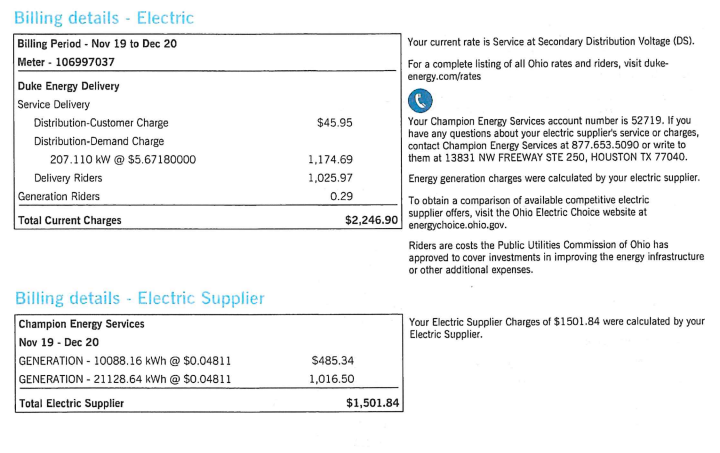
As shown in the image, the measured kilowatt-hours are often billed at a fixed rate (e.g., $0.04811/kWh) by a third-party supplier. If a customer doesn’t use a third-party supplier, they would pay the standard utility rate, which is often higher than competitive supplier rates.
This structure allows you to shop for competitive generation rates while your local utility continues to handle delivery—a significant cost-saving opportunity for many businesses.
The Full Cost Structure of Commercial Electricity
Understanding the complete breakdown of your electricity costs is essential for identifying where savings opportunities exist. While your bill may not explicitly categorize charges this way, commercial electricity rates comprise several distinct components that reflect the journey electricity takes from generation to your facility.
These components include the cost of producing electricity, transporting it across high-voltage transmission lines, distributing it through local networks, and providing customer services and demand management. Each component contributes to your overall rate and can be impacted differently by energy efficiency measures and solar investments.
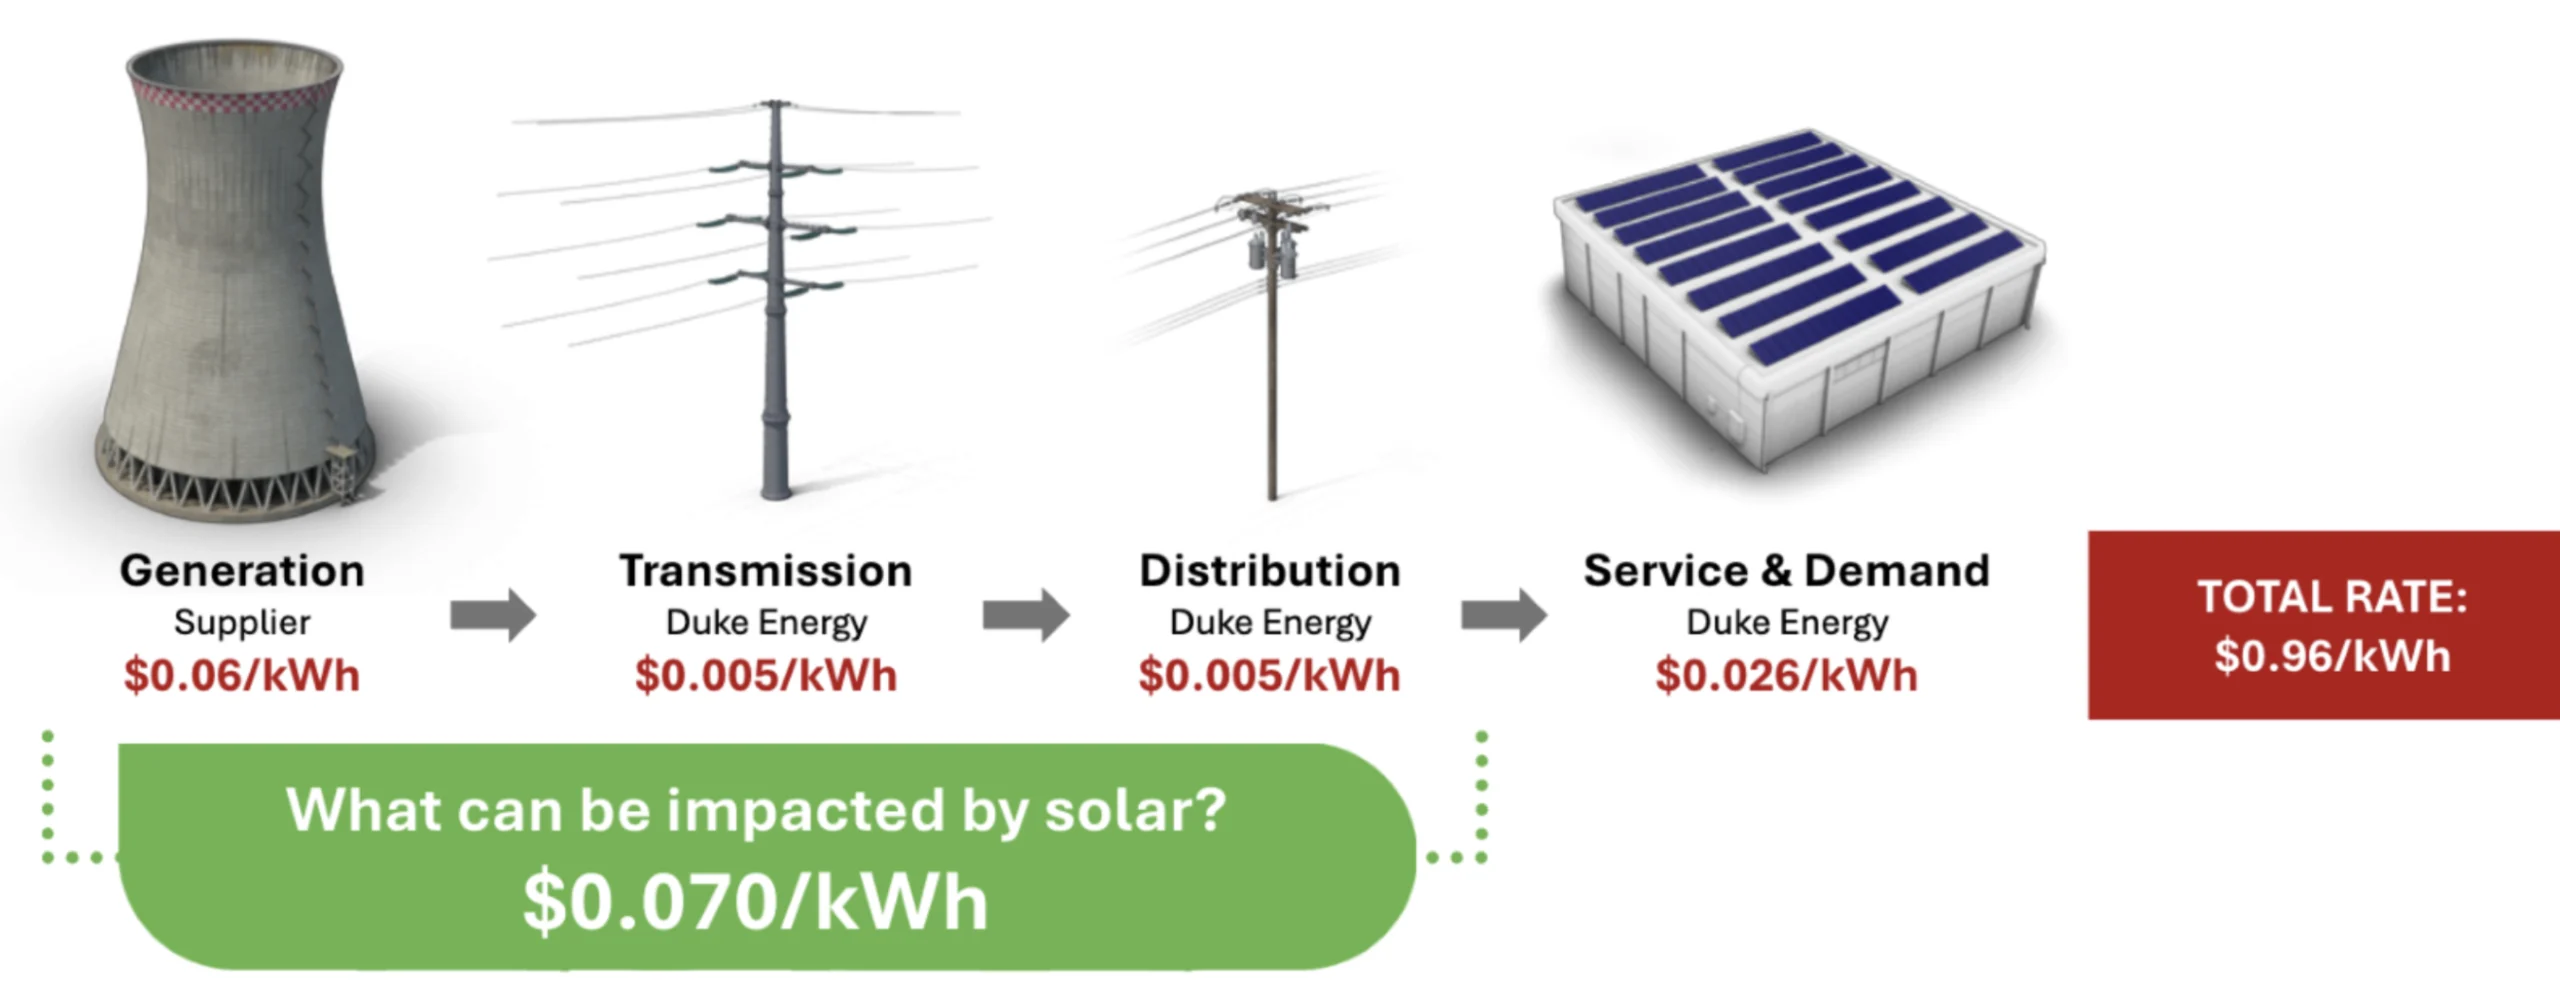
As shown in the image, your total electricity rate (e.g., $0.96/kWh) typically includes:
- Generation: The cost of producing electricity at power plants ($0.06/kWh)
- Transmission: Moving electricity from generation facilities to local areas ($0.005/kWh)
- Distribution: Delivering electricity through local infrastructure ($0.005/kWh)
- Service & Demand: Customer service and peak demand charges ($0.026/kWh)
How Solar Power Transforms Your Electric Bill
Solar power systems impact different components of your bill in distinct ways:
Impact on Usage (kWh) Charges
Solar directly reduces the grid electricity you purchase, lowering usage charges proportionally to your solar production. With net metering, excess production earns credits on your bill. When a business installs solar, their bill shows:
- kWh Delivered: Electricity drawn from the grid
- kWh Received: Excess solar electricity sent back to the grid
- Net kWh: The difference (what you’re billed for)
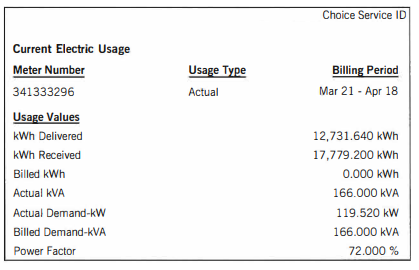
In the example, the business generated enough solar electricity to reduce their billed kWh to zero.
Impact on Demand Charges
Solar can help reduce demand charges, but the impact depends on:
- System size relative to your facility’s needs
- Alignment between solar production hours and your peak demand periods
- Weather patterns and seasonal variations
In most cases, solar installations will lower your demand charges, but the reduction may not be proportional to the energy savings.
Net Metering Benefits
With net metering, excess electricity your solar system produces during high-production periods earns credits that offset consumption during low-production periods. This arrangement can create significant savings. In optimal situations, businesses may pay nothing for energy during certain months and even accumulate credits that roll over to future billing periods.
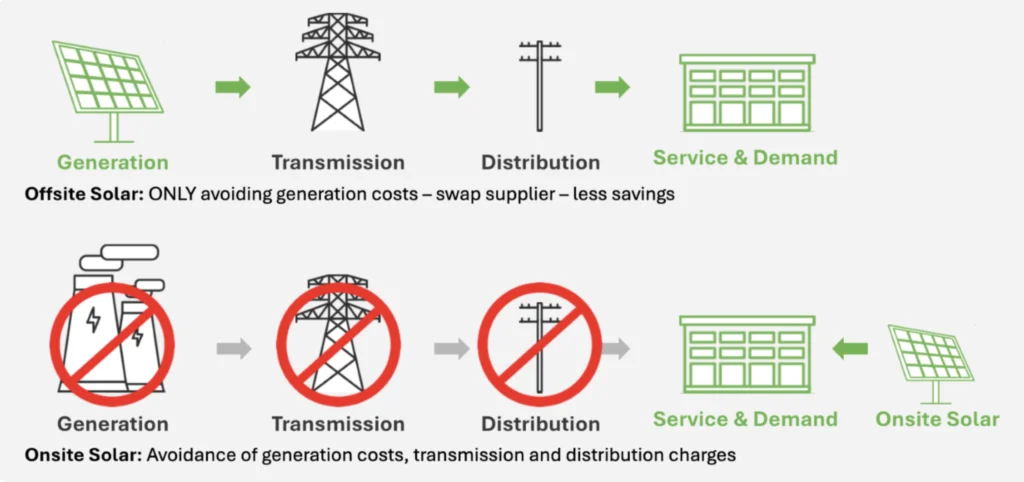
Onsite vs. Offsite Solar: Different Savings Profiles
The Melink Solar presentation distinguishes between:
- Onsite Solar: Systems installed at your facility offset generation costs by reducing purchased electricity ($0.070/kWh impact in the example).
- Offsite Solar: Remote installations can potentially offset generation, transmission, and distribution charges through different compensation structures.
Strategic Bill Optimization Approaches
For Usage (kWh) Reduction
- Energy-efficient lighting and equipment upgrades
- Building automation and controls
- Operational scheduling to minimize unnecessary consumption
- Solar power generation to offset purchased electricity
For Demand (kW) Management:
- Staggered equipment startup to avoid simultaneous power draws
- Load shifting to more evenly distribute energy use
- Battery storage systems to discharge during peak demand periods
- Solar + storage solutions to reduce both usage and demand charges
Analyzing Your Bill for Solar Potential
Before investing in solar, perform these analyses:
- Calculate your effective rate: Divide total bill by total kWh
- Identify peak demand periods: Determine if they align with solar production
- Review your rate structure: Understand how time-of-use factors impact solar savings
- Analyze your load profile: Match solar system size to your consumption patterns
- Evaluate net metering policies: Verify your utility’s compensation for excess generation
Taking Control of Your Energy Future Understanding your commercial electric bill empowers you to make strategic energy decisions. For many businesses, solar power transforms energy from a fixed expense into a controllable asset—providing price stability, reducing operating costs, and advancing sustainability goals simultaneously.
What a Successful Solar Bill Might Look Like
| BILLING ITEM | BEFORE SOLAR | AFTER SOLAR |
| kWh Used | 12,000 | 4,500 |
| kWh from Solar | 0 | 8,000 |
| Net kWh Billed | 12,000 | 500 |
| Demand Charge | $1,500 | $1,400 |
| Energy Charge | $1,800 | $50 |
| Total Bill | $3,300 | $1,450 (or less with credits!) |
For a personalized analysis of how solar can optimize your specific electric bill, contact our team of commercial solar experts today.