Understanding your bill is the first step toward taking control of your energy costs.
Commercial electric bills can be confusing, but once you know what each charge represents, they become a powerful tool for identifying opportunities to save. In this section, we’ll walk you through the main components of a typical commercial bill, explain what those charges mean, and show how solar affects what you pay. We’ll even look at a real-world example from Duke Energy, including how the bill changed after solar was installed.
Whether you’re trying to reduce costs, evaluate demand charges, or simply make sense of where your energy dollars go, this guide will help you read between the lines of your monthly statement.
What You’ll Find in This Section:
- 2.6.1 Reading Your Electric Bill
Learn how to interpret key charges like usage (kWh), demand (kW), delivery vs. supply, and what third-party energy suppliers mean for your bill. We’ll use an easy-to-follow restaurant metaphor to make it all click. - 2.6.2 Breaking Down a Duke Energy Utility Bill
See annotated examples from real Duke Energy bills. We’ll walk through monthly usage data, demand charges, third-party supplier costs, and explain how billed demand differs from actual demand. - 2.6.3 After Solar: How Your Bill Changes
Explore how solar alters your bill with terms like “kWh Delivered” and “kWh Received.” See how net metering works in practice, how credits are applied, and how some customers reduce their energy charges to zero—or even earn credits for future use.
2.6.1 Reading Your Electric Bill #
Think of your electric bill like a restaurant receipt after a big group dinner. You’re not just paying for the food you ate, you’re paying for how fast it was served, who cooked it, who brought it to your table, and maybe even a surcharge if someone special catered the meal. That’s a lot like how commercial electric bills work.
The usage line on your bill, measured in kilowatt-hours (kWh), is like the total amount of food your table ordered. It’s the sum of all the energy your building consumed over the billing period—every lightbulb, computer, HVAC unit, or machine that ran during that time. The more you use, the higher the charge.
Then there’s demand, measured in kilowatts (kW). If usage is like how much you ate, demand is how fast everything hit the table. It measures your peak energy need at any moment, usually the highest spike during the month. Utilities charge extra for that surge because they must have infrastructure ready to handle your heaviest load, even if it only lasted a few minutes. It’s like charging more when the kitchen has to rush 10 meals out at once.
Next comes delivery vs. supply: Imagine paying one vendor to cook the food and another to deliver it. Your supply charge covers the actual generation of electricity, while the delivery charge covers the poles, wires, and infrastructure that bring it to your building. Even if you use less power, those fixed delivery fees often remain.
Finally, if you’ve chosen a third-party energy supplier, your bill might show a separate line for that provider—kind of like ordering from DoorDash instead of directly from the restaurant. You still pay the local utility for delivery, but your electricity itself comes from another source, possibly wind, solar, or another contract you selected for price or sustainability reasons.
Understanding your electric bill helps demystify how energy flows through your facility and where solar can reduce both usage and demand charges, giving you more control over your “energy tab” each month.
Most commercial electric bills break down into:
- Usage (kWh): Total energy consumed over time.
- Demand (kW): Peak power usage at any given moment.
- Delivery vs. Supply: You may pay one entity for energy generation and another for transmission and distribution.
- Third-Party Suppliers: You might have separate line items for a retail energy supplier vs. your local utility.
With Solar
When on-site solar is generating power, your consumption from the grid is lower. In net-metered systems, any excess energy you produce (kWh received by the grid) can offset or even eliminate the kWh portion of your bill. However, some fixed charges or demand charges may still apply.
Want to know how solar specifically changes these bill components?
Jump to Section 2.6.3: After Solar: How Your Bill Changes
Curious about the difference between kilowatt (kW) demand and kilowatt-hour (kWh) usage mentioned here?
Revisit Section 2.2: What’s the Difference Between kW and kWh?
2.6.2 Breaking Down a Duke Energy Utility Bill #
The following examples are from Duke Energy electric bills. Most bills from investor-owned utilities should have these same components or graphs:
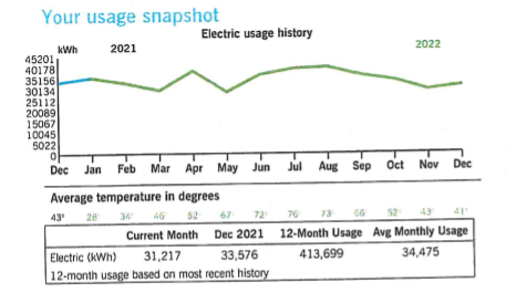
The above graph and table show the total amount of electricity used in kWhs across the last year of usage. It’s normal for usage to be greater in the summer months due to the increased use of air conditioning.
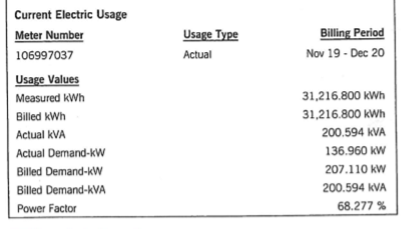
The following table details the usage from just the month that is being billed. The most important values are the Measured kWh and Actual Demand-kW. The Measured kWh is the total energy usage for the month and the Actual Demand-kW is the maximum amount of energy used at once during the month (for example, the spike of energy required to turn on all the lights and machines in a building in the morning). The Billed Demand can be different than the Actual Demand because of the “fine print” terms of the published electric schedule.
Utility companies typically calculate billed demand based on the highest average power usage during a specific time interval (like 15 minutes) within a billing cycle. Actual demand simply refers to the power usage at any given moment, meaning the billed demand will reflect the peak usage during that period, even if it only occurred for a short time, leading to a potential discrepancy between the two figures.
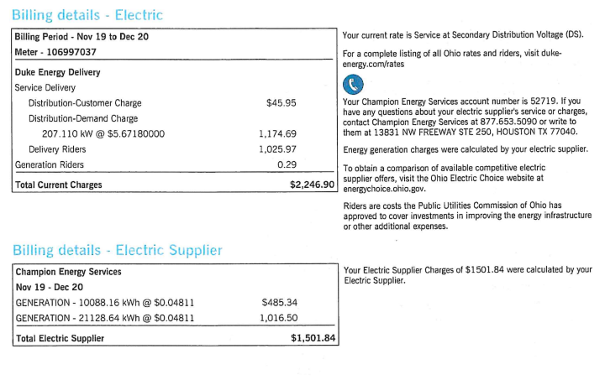
This organization gets their electricity from a third party energy supplier, which is why the billing details are split into two sections. The first, Billing details – Electric, are the charges paid to Duke Energy for delivery of electricity and demand. The delivery is a fixed charge while the demand is based on the Billed Demand-kW from the above section.
The Billing details – Electric Supplier section is paid to the third party energy supplier (in this case, Champion Energy Services). The Measured kWhs from above are billed at a fixed rate ($0.04811/kWh in this case). If the entity didn’t get their energy from a third party supplier, this would be paid to Duke Energy as well at a different (and likely higher) fixed rate.
The same entity later installed solar. The following images are from the electric bills of the same building after incorporating solar:
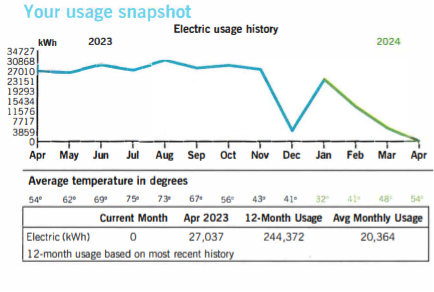
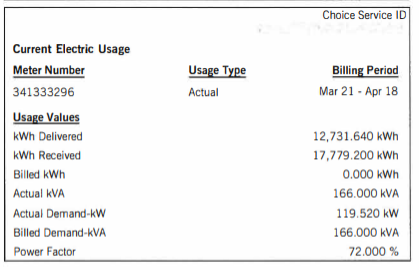
With solar, some energy is drawn from the grid (kWh Delivered) and some is returned to the grid (kWh Received). The net kWh Delivered is billed. Here, the meter spins backwards more than it spins forwards, so 0kWh are billed. The demand is still billed, but it is lower than before.
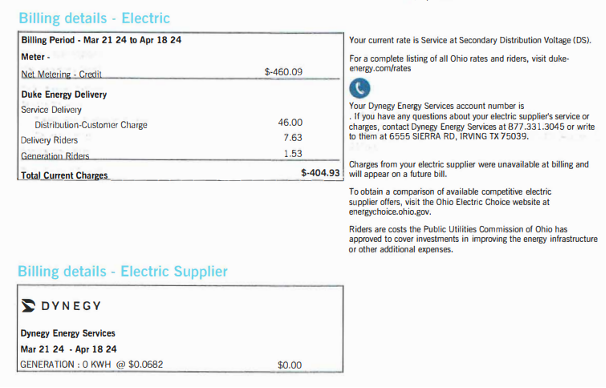
The company receives a credit for the net energy returned to the grid which is used to cover the delivery charges. With those covered and 0kWh to be billed, the company pays nothing for energy for the month. In fact, they still have a net metering credit of $404.93 which will roll over to the next month.
Want to understand the concept of net metering shown in the post-solar bill?
Refer back to Section 2.5: What is Net Metering?
Curious how factors like demand charges influence overall solar savings?
See Section 2.7.5: How Does Utility Rate Structure Affect Solar Savings?
2.6.3 After Solar: How Your Bill Changes #
What will my utility bill look like after going solar?
Installing a solar energy system doesn’t make your electric bill disappear—but it changes how you interact with it. Once solar is online, your bill reflects the difference between what your building uses, what your system produces, and what is exchanged with the grid. This shift in billing format is often where energy savings become tangible.
Understanding New Billing Terms
Here are some key terms you’ll likely see on your bill after going solar:
- kWh Delivered
This is the amount of electricity you still consume from the utility grid—what you draw when your solar system isn’t producing enough to meet your building’s full load (like at night or during high-demand hours). - kWh Received
This is the energy your solar system sends back to the grid—usually when your system is producing more than your building is using in real time. This commonly happens on sunny days when your operations are low or during weekends. - Net kWh
Some utilities display the net difference between delivered and received energy. In a net metered system, this number determines how much you are billed or credited for during that billing period.
Example: If you consumed 10,000 kWh from the grid and exported 9,500 kWh back to it, your net usage would be just 500 kWh.
Applying Net Metering Credits
If your utility offers net metering, you may receive full or partial credit for the kWh you export to the grid. These credits are then applied toward your future energy usage. In strong net metering states, this can result in:
- A $0 energy charge (you used solar or credits to cover 100% of your usage)
- A carryover credit to the next month (if you generated more than you used)
- Reduced energy cost each month (even if you don’t reach full offset)
Some customers build up credits during sunny months, then use them in winter when solar production drops.
Fixed Charges and Demand Charges Still Apply
Even if your system reduces your energy charges to zero, you may still see:
- Fixed Monthly Charges
These cover infrastructure, customer service, and meter maintenance. They’re billed regardless of energy usage. - Demand Charges (kW)
Based on your highest energy “spike” during the billing period, demand charges are often not offset by solar—unless your peak coincides with solar production. Learn more in Section 2.6.1 and Section 2.7.5.
Want to reduce demand charges too? Ask Melink about battery storage or load shifting strategies.
What a Successful Solar Bill Might Look Like
| Billing Item | Before Solar | After Solar |
| kWh Used | 12,000 | 4,500 |
| kWh from Solar | 0 | 8,000 |
| Net kWh Billed | 12,000 | 500 |
| Demand Charge | $1,500 | $1,400 |
| Energy Charge | $1,800 | $50 |
| Total Bill | $3,300 | $1,450 (or less with credits!) |
Reducing your net usage and locking in stable production from solar gives your organization long-term energy cost control.
Thinking about batteries to smooth out demand charges?
See 5.1 System Monitoring and Optimization
Want to decode the demand line on your bill?
Visit 2.6.1 Reading Your Electric Bill
Curious how net metering credits affect your ROI?
Check out 4.4 Levelized Cost of Energy (LCOE)